


Have you ever looked at your Google Analytics dashboard and thought, "this is exactly what I needed from my analytics tool"? If you have, don't bother reading the rest of the blog.
However, if you are like us and feel a little confused and have trust issues with the tool, find out why we vouch for PostHog, a top-tier analytics tool with a cute little hedgehog (that's the main selling point).
Say hi to PostHog
To all the developers, analysts, and marketers reading this blog, nice to see you here, literally, read more later. We recently transitioned from Google Analytics to PostHog, and trust me, it was worth it.
I think it's worth starting with our chequered history of Google Analytics. We've never actually understood what the hell is going on with the tool, and I'm fairly certain we're not the only ones.
We weren't looking for a miracle; we simply wanted to find out how many people came to our website, from what platform, and ultimately what made them want to buy a website. Because surely, it couldn't be from just a blog post.
The big difference here is the setup required to get Google Analytics working. Yes, there's the third-party Next.js library, but that's only half of the battle. Once this is added, you need to start looking at firing off specific events, which you then need to link up in one of the many panels in the dashboard. It's hellish.
Compare this to Posthog. You run npx -y @posthog/wizard@latest --region us (change region to EU if you enjoy bureaucracy) and you're basically good to go. The startup wizard correctly guessed the two most important events on our site, and we were up and monitoring those events in less than an hour. End-to-end, yes, really.
One piece of advice we'd start with for anybody looking into analytics is:
Start with just one or two events, no more It's going to be easier to measure, without murkying your data with superfluous events. Start by picking the thing that makes you money and double down on understanding the user flow.
Now that you know the analytics is tracking correctly, we want to move on to querying data and presenting beautiful dashboards.
Dashboards
This is my dashboard. There are many like it, but this one is mine. With that out of the way, trust us when we say this: keep your most important metric on your dashboard's homepage. In our case, it looks like this.
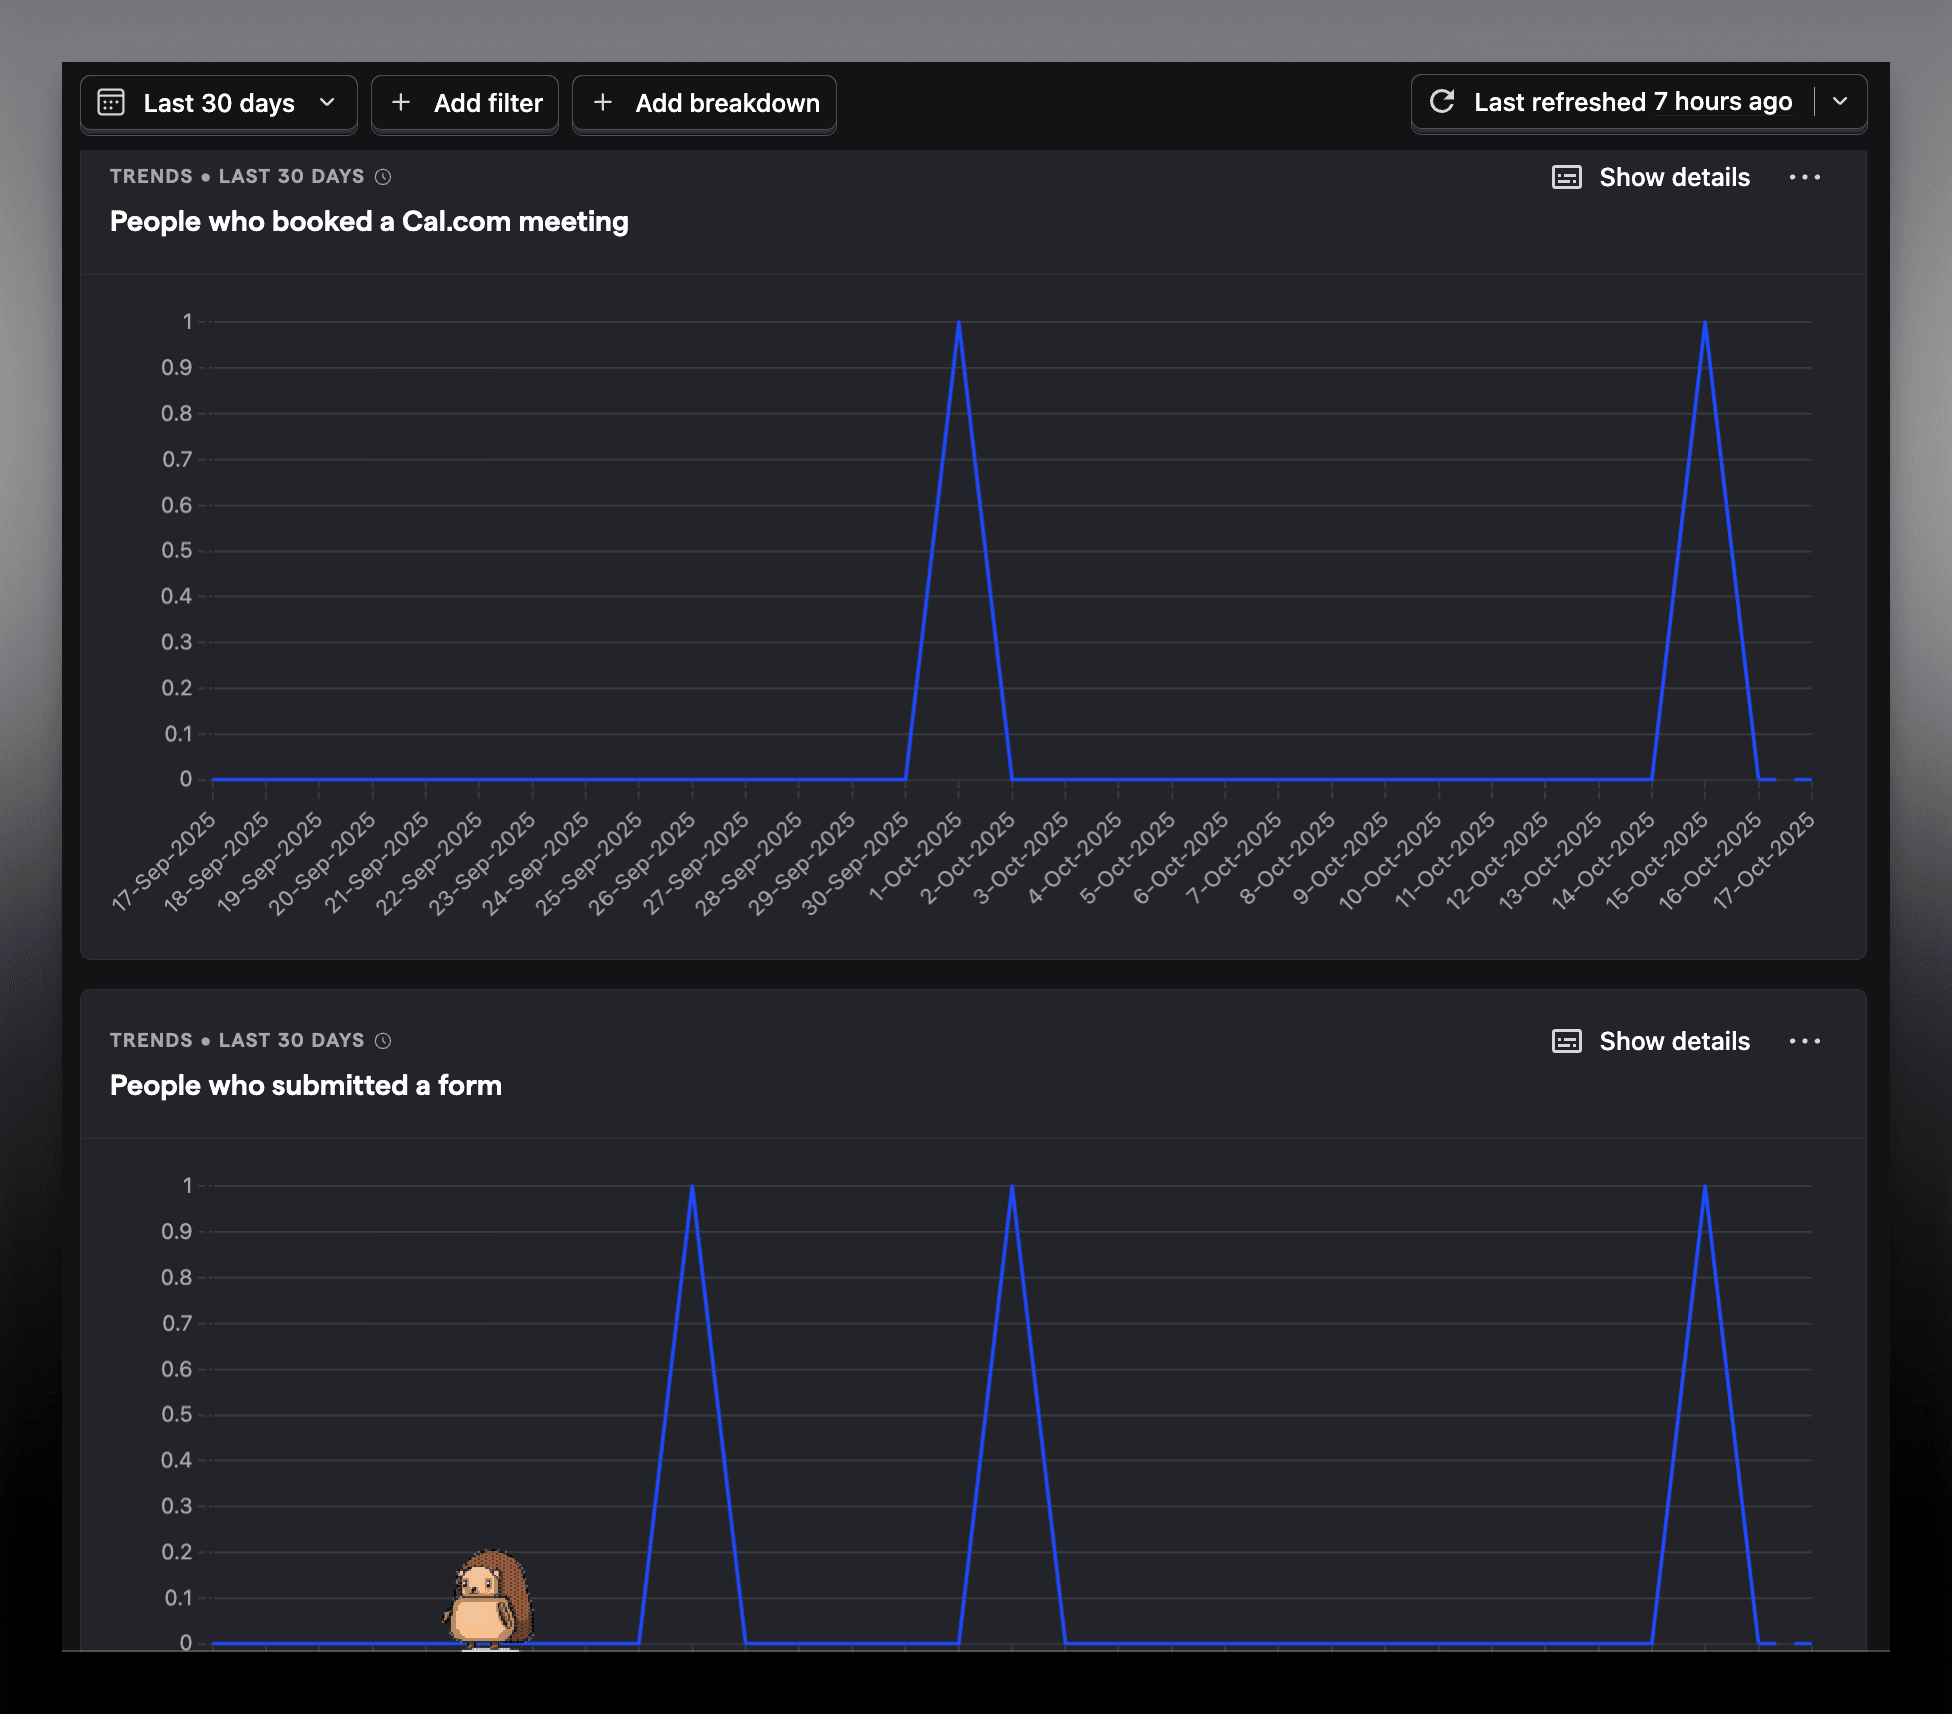
The reason why? Well, those spikes are almost directly correlated to client calls that have led to projects. Don't worry, you can join those spikes. But it's what keeps the lights on and leads us to being able to write half-baked articles like this.
Just kidding, but the point still remains, don't create too much data from the get-go, as you'll want to focus on the metrics that count.
We know you didn't rage-click on this blog
Exploring PostHog, you will come across an event named $rageclick. This single event helped us fix so many of our UI bugs and enhance user experiences. In theory, the event will look like this.
 *Rageclick event illustration *
In case you didn't know, you can press CMD+K/CTLR+K to see the magical command palette, and literally do anything that is on your mind.
Moving forward with rage clicks, let me show how we created our dashboard and caught the UI bugs in our products, our way.
Click on the little + icon on the 'Product analysis' button, go to trends, in the 'Series' dropdown, select Rageclicks, and choose Unique users in the dropdown beside it, and you are good to analyse all the session recordings of the rageclicks. Too much information? We made a video to simplify it.
We're always watching
In case you didn't notice, you can see the user's session recording by pressing on the tip of the graph patterns. Yes, creepy, we know.
The next task, after filtering out rage-click recording sessions, is to determine whether the event was a genuine rage-click or just the user being impatient.
If your developers did a bad enough job of the user experience on your website, you'll see a whole host of rage clicks. Here's a breakdown below of all the different events firing off from just one user session inside the screen recording section.
Heatmaps in action
Although in beta right now, heatmaps have already helped us find interesting, actionable insights. To use heatmaps, you can launch the toolbar directly, which will take you to your product/website.
You get a load of options to select from, including clicks, dead clicks, rage clicks, and scrolling depth analysis, all according to your needs.
But how are we finding the useful insights that matter? For us, it takes a little bit of figuring out, looking for misclicks around buttons, or interacting with non-interactive parts of the site. Essentially, find the misclicks and rage-clicks, and start from the simplest issues to solve, all the way up to complex ones.
No spam, only good stuff
Subscribe, for more hot takes
Steal our Sanity code
As you've probably guessed, we're using this with Sanity, and we're being very intentional about how we track our data. If you're looking to do the same and want a way of identifying who submits your forms, here's a very stripped-down version using Shadcn/ui.
You can improve this with Typescript and better previews, but this is the bare bones, same principle for the frontend, we'd obviously recommend Zod and Typescript and all that jazz, but this is barebones to get you started. If you want to head down the rabbit hole, I've got just the guide for you
If you struggle getting any of this setup, get in touch, we always like to hear somebody is actually reading one of our guides, and we're not just screaming into the void.
Should I learn SQL?
If you're already a nerd, you might actually know how to use SQL. It's great that you took all that time to learn, but now that learning is redundant because of MCP (Model Context Protocol).
If you've been living under a rock and don't know what MCP means, it's essentially a way for companies to extend their functionality to be able to talk to AI. This is important for you because instead of having to learn all the syntax to write the query below, we can simply prompt an AI to do it instead.
 SQL query demonstration
So if you're familiar with Cursor, Claude, or any of the other AI IDEs, you can connect Posthog in one command. npx @posthog/wizard mcp add
This then allows you to talk directly to PostHog in normal sentences to get dashboards set up exactly the way you want. E.g.:
You would ensure the MCP was active and drop the snippet above into whatever you would choose. Or if you're exceptionally lazy and already use Cursor, you could just press this button.
The first ones on the house
More on PostHog
Here's a cliché line you hear everywhere: yes, this is just the tip of the iceberg when it comes to what we can do with this tool. We are in the process of mastering it, and will definitely document it as we really get the hang of it. Until then, happy learning, and see you guys soon.
If you want to use an objectively worse analytics tool, you are more than welcome to read our blog on how we use Google Analytics for valuable insights.